Reviewing Intake Survey Data
What is an Intake Survey?
Each semester, students are asked to complete an Intake Survey. This is a brief 3-5 question survey. The Intake Survey is often the first experience that students have in Navigate. It is a mandatory questionnaire that students fill out as soon as they first launch the mobile app if downloaded within an active Intake Survey time range.
Viewing Survey Results:
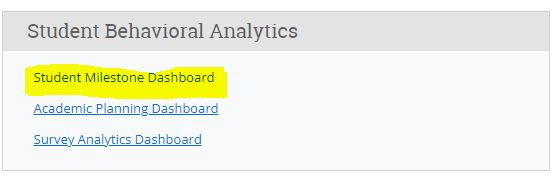
To view students' responses to the Intake Survey in aggregate, click on the Analytics icon  on the left navigation. In the Student Behavioral Analytics Section, Click on the Student Milestone Dashboard.
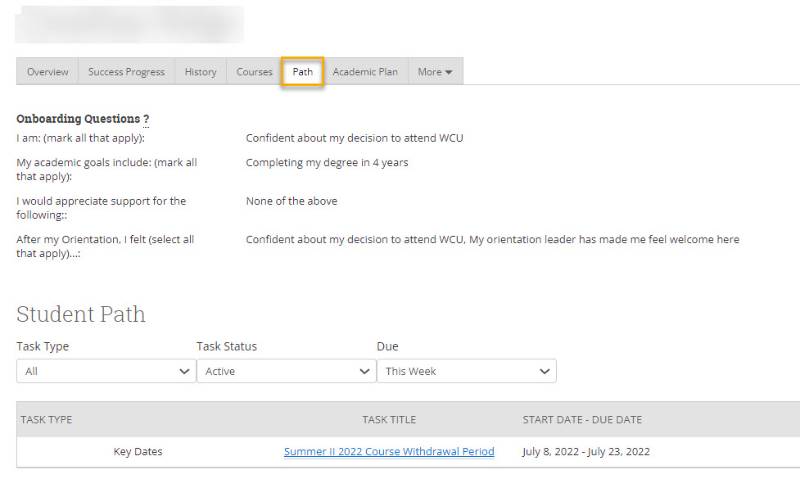
If you are reviewing a student's information, this information also appears on the Path tab of a Student Profile.
Overview
Student Milestones Analytics is a tool to help you access student utilization and behavioral data. They were designed to answer your common questions about what students are doing in the application, what problems they are encountering, such as holds, and their sentiment based on responses to several surveys.
These dashboards allow staff and leaders to access this information on a regular basis to intervene with students who have indicated they may be at risk of not persisting or succeeding, based on how they answer quick polls indicating that they don't feel like they belong at the institution if they have unresolved holds that prevent registration, et cetera.
This feature guide explains how Student Milestone Analytics work, how to use the insights to find potential student populations of interest, and how to target interventions within the Navigate platform to these student populations.
Student Milestone Analytics opens to the Overview tab.
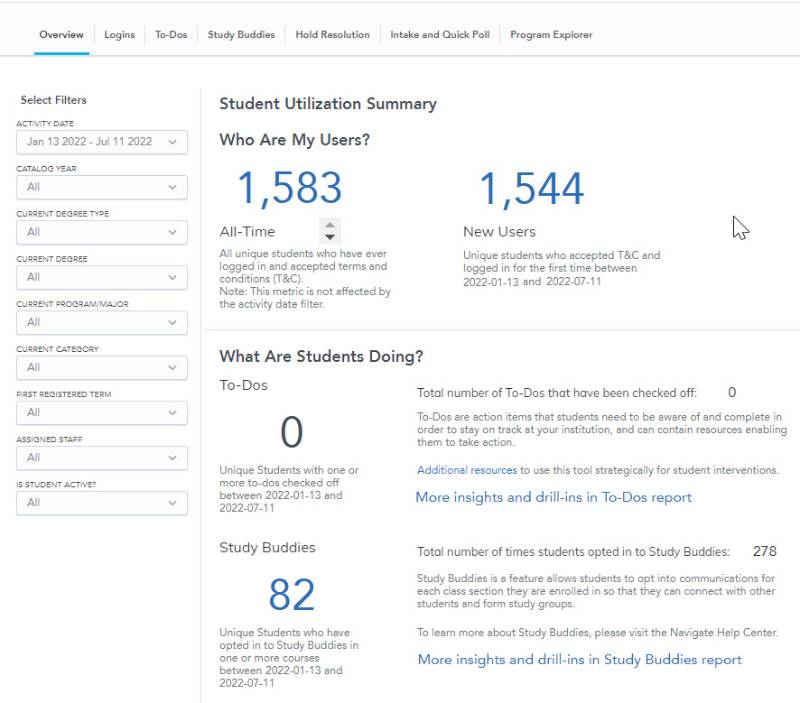
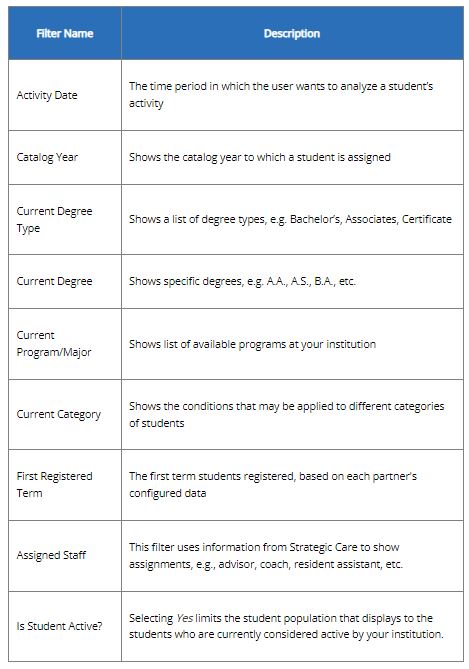
You can customize the data you view by using select filters on the left Navigation.
At the top of the dashboard is the Student Utilization Summary. This demonstrates your student population's total usage of Navigate on both desktop and mobile. Users see the total number of students who have logged into Navigate Student ever and how many unique users accepted the terms and conditions and logged in for the first time during your activity range.
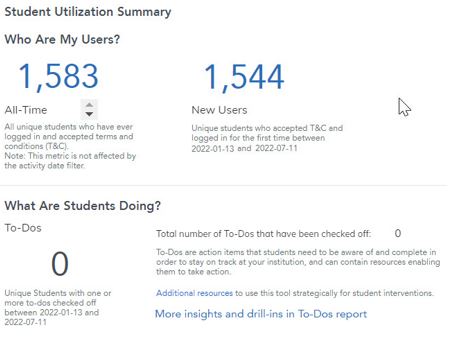
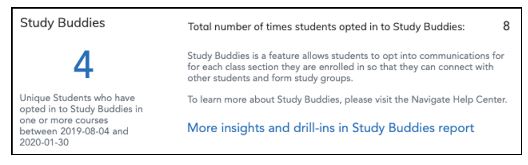
Next, we share summary numbers on how many To-Dos students have checked off in the time period selected as well as overall. We also cover the usage of Study Buddies. To-Do checkoffs are covered in-depth on the To-Dos tab. Study Buddies feature utilization is covered on the Study Buddies tab. Selecting the number shows a list of students that you can download to an Excel spreadsheet.
The next report on the Overview tab is How Are Students Hearing from You. This report contains three metrics, which display the number of opt-ins for email, text, and push notifications.
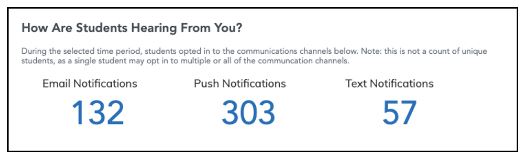
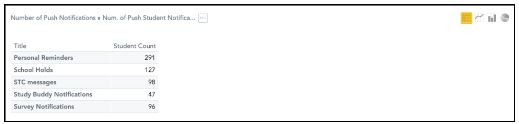
Selecting the number of Push Notifications opens a report that tells you what kinds of push notifications have been opted-in to. This data can also be downloaded.
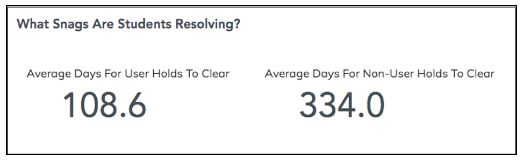
The next report covers how long holds take to clear and contrasts the length of time to clear holds for Navigate Student users vs non-users; a topic covered in depth in the Holds tab of these analytics.
The final report on the Overview tab is a summary of data that can be used to understand student sentiment across several surveys in Navigate Student.
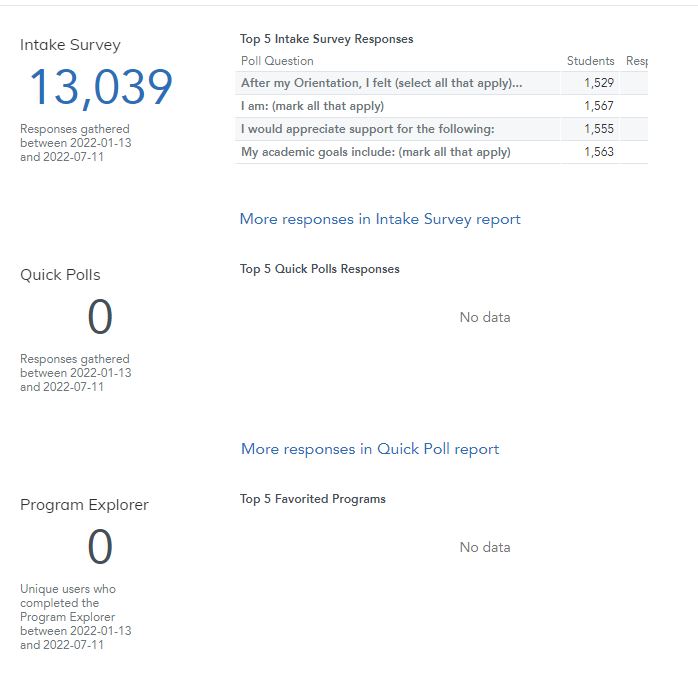
First, you see Intake Survey Responses. This shows three metrics:
- The number of total responses the intake survey during the time range. For example, two people answering a four-question survey would equal 8 responses.
- The five most answered intake survey questions.
- The number of students that answered the question in that time period.
The next report is Quick Poll results, which lets you see how many responses have been submitted to your five most responded-to Quick Polls. Selecting the number opens a list of students who responded to the Quick Poll, though not the response. The Quick Poll tab in the top bar of the analytics page has more information.
Other Tabs:
Logins Tab
This tab enables users to look more closely at student utilization data for Navigate Student, such as the proportion of logins that were from new users as compared to return users. It also shows user logins per month in the Activity Date range. Selecting a number in the bar graph opens a report with the students who logged in during the month.
To-Dos Tab
This tab in Student Milestone Analytics shows To-Dos that have been completed. We do not yet distinguish between those that a student has reported that they completed and those that were reported as completed in your SIS. This page allows users to see which students have checked off the most to-dos and which to-dos have been checked off the most.
Study Buddies Tab
This section of Student Milestone Analytics summarizes the utilization of the Study Buddies feature. All metrics and tables show utilization data for a selected Activity Date Range, chosen in the filter panel. The filters are the same as the ones on the Overview tab.
Hold Resolution Tab
This tab of Student Milestone Analytics shares data about student holds for students who use Navigate Student versus students who do not use Navigate Student in the Activity Date Range. On this tab, students who use Navigate Student are called users. Students who do not use Navigate Student are called non-users.
Intake and Quick Poll Tab
The Intake and Quick Poll tab of Student Milestone Analytics give insight into the results of polls students have taken. It allows staff to obtain lists of students sortable by their responses. Staff can act if poll answers indicate the need for intervention.
Program Explorer Tab
The Program Explorer tab of Student Milestone Analytics gives deeper insights into student answers to Program Explorer questions and fields.
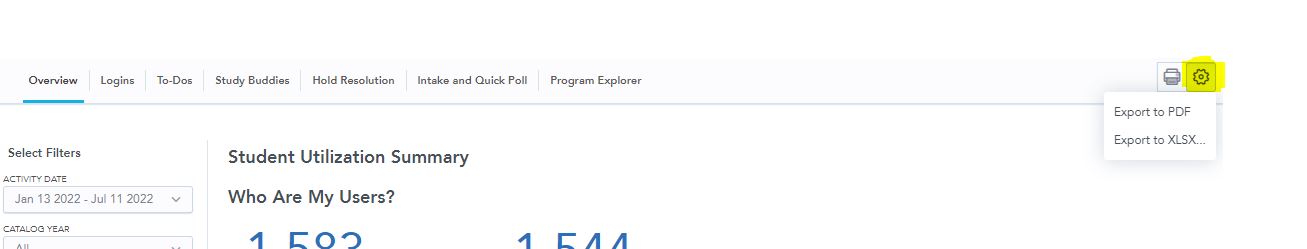
Exporting a Report
You can export a report as either a PDF or an Excel spreadsheet by clicking on the gear icon and selecting your choice, on each tab to download the data.