
Aerosol Characterization
This work is being performed in collaboration with Dr. Ronald G. Pinnick and Dr. Steven C. Hill at the U.S. Army Research Laboratory. The TAOS technique used to collect this data was developed with Dr. Yong-Le Pan and Dr. Richard Chang at Yale University.
Currently, we are trying to perform data analysis on 10,000 elastic scattering patterns
collected from single aerosol particles in Las Cruces, New Mexico. A paper that discusses
how we detect the patterns can be found in the Journal of Geophysical Research, Vol. 111, D12212, doi:10.1029/2005JD006774, 2006 .
Scattering patterns consecutively captured from 70 particles are shown in the PDF
files below. The intensity is on a log scale.
Unwrapping of TAOS Patterns
| Description | Image of Patterns |
|---|---|
| This is an example Two-Dimensional Angular Optical Scattering (TAOS) pattern detected from a spherical particle. This is the raw data before it has been 'unwrapped'. |
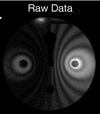 |
| Here the data has been replotted as Polar Scattering Angle versus Azimuthal Scattering Angle. The vertical axis is the Polar Scattering Angle that ranges from 0 degrees to 180 degrees. The horizontal axis the the Azimuthal Scattering Angle that ranges from 0 degrees to 360 degrees. |
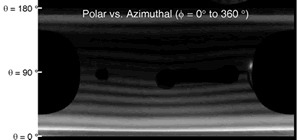 |
| Here the data has been replotted to show the scattering of the forward and backwards hemispheres. |
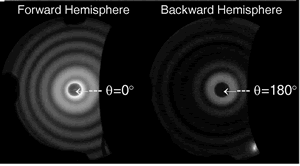 |
| All three of these plots are combined on a single page, as shown, for each particle detected. |
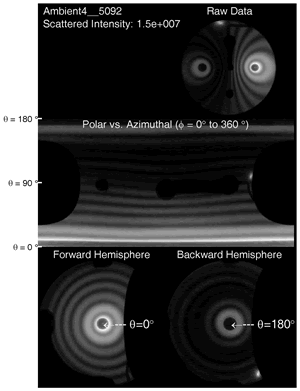 |